 Today, the Federal Reserve Bank of Dallas released their latest read on manufacturing in their region indicating that manufacturing activity worsened with the current general business activity index declining to a contraction level of -3.4 while assessments of future general business activity index declined to 15.17.
 Monday, April 30, 2012
The Federal Reserve Bank of Dallas Texas Manufacturing Outlook Survey: April 2012
Today, the Federal Reserve Bank of Dallas released their latest read on manufacturing in their region indicating that manufacturing activity worsened with the current general business activity index declining to a contraction level of -3.4 while assessments of future general business activity index declined to 15.17. Friday, April 27, 2012
University of Michigan Survey of Consumers April 2012 (Final)
 Today's final release of the Reuters/University of Michigan Survey of Consumers for April indicated a slight increase in consumer sentiment from the prior month with a reading of 76.4 with improvement on an annual basis with the level increasing 9.46% above a year ago while one year inflation expectations eased to 3.2%.
 The Index of Consumer Expectations (a component of the Conference Board's Index of Leading Economic Indicators) climbed to 72.3, and the Current Economic Conditions Index declined to 82.9.
It's important to recognize that consumer sentiment has seriously eroded over the past few months with the current results remaining near levels not seen since 1980, a major indication that consumers are in the process of tightening even further on spending.
Bull Trip!: GDP Report Q1 2012 (First Rough Estimate)
 Today, the Bureau of Economic Analysis (BEA) released their first "estimate" of the Q1 2012 GDP report showing that the economy continued to expand with real GDP increasing at an annualized rate of 2.2% from Q4 2011.
 On a year-over-year basis real GDP increased 2.08% while the quarter-to-quarter non-annualized percent change was 0.55%.
The latest quarterly results indicate that the most notable source of weakness in the economy came from government defense spending which declined at a rate of 8.1% from Q4 2011 while other categories such as non-residential structures also saw notable weakness declining at a rate of 12% from Q4 2011 shaving 0.35% from real GDP.
Fixed residential investment, on the other hand, expanded notably (supposedly) increasing at a rate of 19.1% while over the same period.
Keep in mind that these results are likely very poorly estimated and are sure to be revised notably in following quarters and even years to come.
Thursday, April 26, 2012
Skaneateles Real Estate - The Weekly Update
Everyone I speak with is busy. Homes appear to be selling at an extraordinary rate, or at least are being viewed. My listings are truly doing well and I am glad for that. I just finished putting stamps and address labels on post cards to be sent out about one of my newest listings, 3803 Gray Ledge Terrace. The post cards coincide with the first open house this Sunday from 1:00 until 3:00. It has gotten rave reviews from Realtors who saw it at the brokers' open last Tuesday. The owners have done everything to make it sell - their closets are phenomenally de-cluttered, the countertop is new and quartz, the appliances are upgraded, and if the weather would cooperate the pool would be inviting! But the most important thing they did years ago - they chose a lot at the very back of Buxton Woods, and a treed lot at that. Location, location...! Come Sunday and see - Town of Onondaga but Marcellus Schools. (Seneca Turnpike past OCC to a right on Cedarvale - ICJ Cookies on one side and the new Nice n' Easy complex coming soon on the other side. Go north on Cedarvale almost to Howlett Hill - Buxton Woods' entrance is on the right.)

And now the update....
Currently there are 99 single family homes listed as active in the Skaneateles area of the multiple listing service. Of these, 30 are in the Village and 27 are waterfront of some type. There are four new listings, one of which is a re-list of a Village home. The waterfront property is priced over a million dollars, but quite lovely. Another Village home came on - low $300,000. The last new listing is actually a restaurant currently just outside the village.
Three single family homes were marked contingent. One is a fairly new listing that got a great deal of attention and is now under contract - think $400,000 price range. The second contingent property has been there quite a while and slowly been reduced in price until everyone wanted it - again, village. The last has been listed a bit, but now has found a buyer in the mid-$200,000s. There are 25 properties marked under contract in some way. Nice.
Three more homes closed in the past week. Two were in the village - notice a theme developing here? - and the third was not too far out with a bit of land surrounding it. That brings to 24 the total number of closed homes so far this year. Maybe we can get to the second twenty homes even quicker than the first twenty. I aim to help!
See you Sunday!
Pending Home Sales: March 2012
 Today, the National Association of Realtors (NAR) released their Pending Home Sales Report for March showing that pending home sales improved notably with the seasonally adjusted national index climbing 4.1% since February while increasing 12.8% above the level seen in March 2011.
 Meanwhile, the NARs chief economist Lawrence Yun suggests that, based on the current trends, 2012 could see the best selling in five years.
"The spring home buying season looks bright because of an elevated level of contract offers so far this year, ... If activity is sustained near present levels, existing-home sales will see their best performance in five years. Based on all of the factors in the current market, that’s what we’re expecting with sales rising 7 to 10 percent in 2012."
The problem is though, the MBA Purchase Index is not currently capturing any significant rise in purchase contract activity which begs the question... how are the buyers that the NAR sees in the pending index financing their purchase? ... Cash?
The following chart shows the seasonally adjusted national pending home sales index along with the percent change on a year-over-year basis as well as the percent change from the peak set in 2005 (click for larger version).
The Chicago Fed National Activity Index: March 2012
 Today’s release of the Chicago Federal Reserve National Activity Index (CFNAI) showed a weakening of the national economy with the index dropping into negative territory at -0.29 while the three month moving average also declined to 0.05.
 The CFNAI is a weighted average of 85 indicators of national economic activity collected into four overall categories of “production and income”, “employment, unemployment and income”, “personal consumption and housing” and “sales, orders and inventories”.
The Chicago Fed regards a value of zero for the total index as indicating that the national economy is expanding at its historical trend rate while a negative value indicates below average growth.
A value at or below -0.70 for the three month moving average of the national activity index (CFNAI-MA3) indicates that the national economy has either just entered or continues in recession.
Extended Unemployment: Initial, Continued and Extended Unemployment Claims April 26 2012
 Today’s jobless claims report showed a slight declined to initial unemployment claims and an increased to continued claims while seasonally adjusted initial claims continued to trend below the closely watched 400K level.
 Seasonally adjusted “initial” declined to 388,000 claims from last week’s revised 389,000 claims while seasonally adjusted “continued” claims increased by 3,000 resulting in an “insured” unemployment rate of 2.6%.
Since the middle of 2008 though, two federal government sponsored “extended” unemployment benefit programs (the “extended benefits” and “EUC 2008” from recent legislation) have been picking up claimants that have fallen off of the traditional unemployment benefits rolls.
Currently there are some 3.14 million people receiving federal “extended” unemployment benefits.
Taken together with the latest 3.44 million people that are currently counted as receiving traditional continued unemployment benefits, there are 6.58 million people on state and federal unemployment rolls.
Wednesday, April 25, 2012
Reading Rates: MBA Application Survey – April 25 2012
 The Mortgage Bankers Association (MBA) publishes the results of a weekly applications survey that covers roughly 50 percent of all residential mortgage originations and tracks the average interest rate for 30 year and 15 year fixed rate mortgages as well as the volume of both purchase and refinance applications.
 The purchase application index has been highlighted as a particularly important data series as it very broadly captures the demand side of residential real estate for both new and existing home purchases.
The latest data is showing that the average rate for a 30 year fixed rate mortgage (from FHA and conforming GSE data) declined 2 basis points to 3.92% since last week while the purchase application volume increased 2.7% and the refinance application declined 5.6% over the same period.
The following chart shows the average interest rate for 30 year and 15 year fixed rate mortgages since 2006 as well as the purchase, refinance and composite loan volumes (click for larger dynamic full-screen version).
FHFA Monthly Home Prices: February 2012
 Yesterday, the Federal Housing Finance Agency (FHFA) released the latest results of their monthly house price index (HPI) showing that, nationally, home prices increased 0.29% since January rising 0.45% above the level seen in February 2011.
The FHFA monthly HPI are formulated from home purchase information collected from mortgages that have been sold to or guaranteed by Fannie Mae and Freddie Mac.
New Home Sales: March 2012
 Yesterday, the U.S. Census Department released its monthly New Residential Home Sales Report for March showing a notable monthly decline with sales dropping 7.1% since February but rising 7.5% above the level seen in March 2011 and remaining at an historically low level of 328K SAAR units.
 It's important to recognize that the inventory of new homes has now fallen to a new series low at 144K units, lowest level seen in in at least 47 years while the median number of months for sale increased to 7.8.
The monthly supply increased to 5.3 months while the median selling price increased 6.35% and the average selling price increased 11.66% from the year ago level.
The following chart show the extent of sales decline to date (click for full-larger version).
The First Twenty - 2012
Blogger changed yesterday and threw me into a tailspin. I am proud to say I worked it all out and I can write again. But for a while I was worried.
The very good news is that I am writing about the first twenty closings in the Skaneateles area of the multiple listing service on April 25th. Last year I wrote on June 27th! We are doing well, very well.
I am changing the reporting just a bit. The same "just the facts" - address and sale price. However, I want to break it up a bit for better understanding. There will be three sections: Village, Town and Waterfront. Enjoy!
Village
113 Orchard Road - $427,137 (new construction)
116 Orchard Road - $440,000 (new construction)
23 West Elizabeth Street - $128,000
30 East Lake Street - $135,000
23 East Street - $250,000
77 Onondaga Street - $160,000
8 Wicklow Drive - $310,000
8 Highland Street - $127,000
9 State Street - $180,000
Waterfront
3125 East Lake Road - $980,000
72 Carlton's Cliff - $345,000
2686 East Lake Road - $269,900
2114 Lakeview Lane - $485,000
Town
1358 New Seneca Turnpike - $260,200
2817 Nunnery Road - $415,000
51 Calemad Drive - $332,000
1206 Hencoop Road - $190,000
3201 West Lake Road - $175,000
3244 East Lake Road - $279,000
Lot 11 Butters Farm Lane - $445,600 (new construction)
Tuesday, April 24, 2012
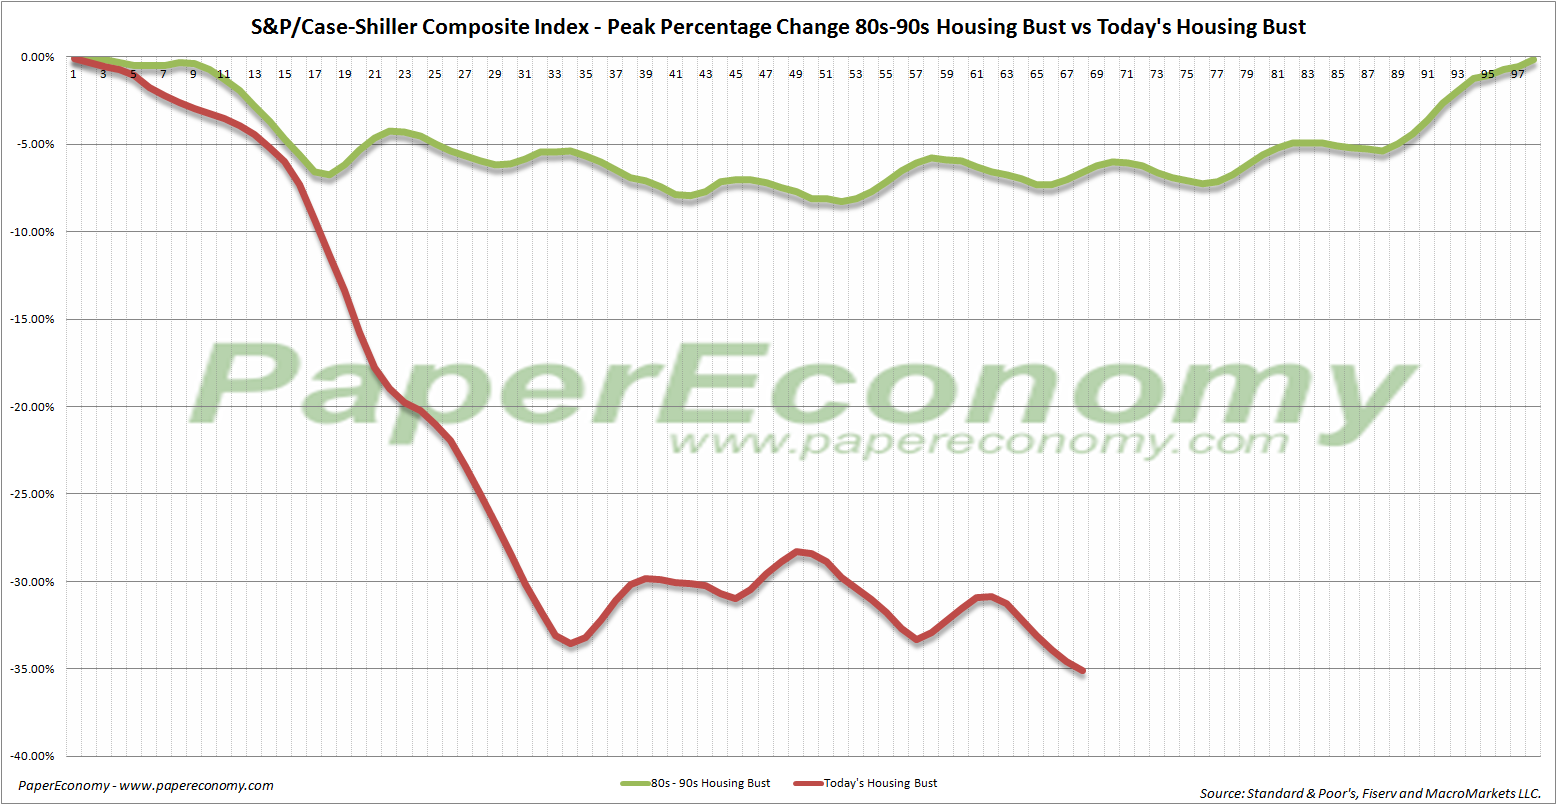
S&P/Case-Shiller: February 2012
The latest release of the S&P/Case-Shiller (CSI) home price indices for February reported that the non-seasonally adjusted Composite-10 price index declined 0.78% since January while the Composite-20 index declined 0.76% over the same period resulting in the lowest level seen to on the Composite-10 since April 2003 and the largest peak decline seen since the nearly six year old housing bust began in 2006.
The latest CSI data clearly indicates that the price trends are experiencing a declining trend into the typically less active summer and fall season and as I recently pointed out, the more timely and less distorted Radar Logic RPX data is continuing to capture notable falling prices driven primarily by seasonality.
The 10-city composite index declined 3.60% as compared to February 2011 while the 20-city composite declined 3.49% over the same period.
Topping the list of regional peak decliners was Las Vegas at -61.71%, Phoenix at -54.22%, Miami at -50.34%, Tampa at -47.96% and Detroit at -46.01%.
Additionally, both of the broad composite indices show significant peak declines slumping -35.08% for the 10-city national index and -35.02% for the 20-city national index on a peak comparison basis.
To better visualize today’s results use Blytic.com to view the full release.


Monday, April 23, 2012
Happy Monday!
Wow this weekend has flown by!
Lots going on ... fun stuff and work ... so it was a good mix :)
Most importantly, I am aunt :) My cousin/sweetest/favorite person in the entire world had her sweet baby boy this weekend and he is ADORABLE!
Henry Graham Hatfield
(will go by Graham, love it!)

How freaking cute is he?
9.5 lbs!!!
And she was TINY ... barely looked pregnant! Could not believe he was such a big boy!
I wish they lived closer, I can't wait to squeeze his cheeks and kiss his face ha!
(even if he is a Tennessee fan hahahaha jk love you all!)
Next on the baby train ... my friend since high school/does my hair/BarreAmped owner teacher, Leigh Ann, had her baby shower this weekend!
First let's talk about how pretty she is ... talk about a glowing pregnant lady ... so pretty!


Pictures were taken by her friend, Abby Custer, who is an amazing photographer in IN ...
"Like" her Fbook Page HERE
I love her pics! They are awesome!
Sew Jwl did it again with her amazing monogram skills haha ;)
How cute are these burp cloths and gowns I got for Savannah ...


Love everything she makes!
If you are local and not using her for your monogram items you are missing out!!
Visit her Facebook Page and "Like" it HERE
I forgot my camera at her shower :(
But did get a couple cute pics of the candy bar...


Loved all the bedazzled candy jars :) lol
It was a great shower, can't wait for baby Savannah to get here! Congrats Leigh Ann! XO
Soooo Saturday night was my 10 Year High School Reunion...
I really didn't feel old prior to this event, and I still sometimes kind of feel like it was just yesterday when I was roaming the halls of PLD trying to figure out how to leave school early ha
But something about the word "reunion" kind of made me feel old all of the sudden lol
I was still really excited to go and see people and mingle :)

And of course I drug Chris along for moral support, like any good boyfriend should do :)

I wore an Alice & Trixie maxi dress... cute and comfy :)

Emily and I

Miss you Casey!! XO

Me, Megan & Leigh Ann <3

Me, Maggie & Caroline :)
It was a LOT of fun, more fun than I expected that's for sure! I'm so glad I went. It was good catching up with everyone who I don't get to see all the time due to everyone's crazy busy lives!
Lastly,
Do you watch Bill & Giuliana??

I love them. I think they're so funny and down to earth.
Giuliana found out last October she had breast cancer, and had been trying to have a baby for a while so it was sad that after the diagnosis, she found out she couldn't even try to get pregnant for 2 years!
Well this morning on the TODAY show they announced they are having a baby!
You can read about it HERE.
Ok, that's all for today!
Hope you have a fabulous Monday :)

More Pain, Less Gain: S&P/Case-Shiller Preview for February 2012
 As I demonstrated in prior posts, given their strong correlation, the home price indices provided daily by Radar Logic, averaged monthly, can effectively be used as a preview of the monthly S&P/Case-Shiller home price indices.
The current Radar Logic 25 MSA Composite data reported on residential real estate transactions (condos, multi and single family homes) that settled as late as February 20 and averaged for the month indicates that with increasing spring transactions has come an increase of prices (the typical trend) with the national index increasing 0.71% since January but falling 3.76% below the level seen in February 2011.
The Radar Logic index will likely be capturing an increase in prices from now until late summer as transactions continue to mount.
Look for tomorrow's S&P/Case-Shiller home price report to reflect this declining trend though to a lesser degree due to its three month rolling-average nature with prices moderately higher.
Saturday, April 21, 2012
"Know Your Neighborhood"
A few weeks ago Suzanne Thompson from the Camillus office of Realty USA called to ask if I could hold my listing at 208 Dorwin open on Sunday, April 22nd. The Greater Syracuse Association of Realtors was sponsoring a "Know Your Neighborhood" weekend and encouraging agents in specific areas to have open houses. This Sunday it's the Valley in Syracuse. My sellers were thrilled to hear of this program and have worked diligently to make our open house possible. I will be there from 1:00 to 3:00 - please stop in and say hello, especially if you read about it here on my blog.

Just a bit about the home....All those windows you see are the front porch, not included in the square footage because it's a non-heated space - but a great liveable space a good part of the year. Inside you will find high ceilings in the living room, dining room, kitchen and first floor bed and bathroom. You can eat in the kitchen in a nook overlooking the very deep back yard. Upstairs is a master bedroom with two large closets - the dormer in the photo is the bedroom, creating a cathedral ceiling. There are two more bedrooms, and another full bath. One of the bedrooms was probably an attic originally so has a lot of interesting angles to it.
The price is a very reasonable $96,000 - cheaper than renting. With a few thousand dollars down, your payment including taxes and insurance will be less than $1,000 per month. If you want to see this home - come to the open house, or make an appointment with me (447-0441) or check it out online at http://realtor.com/ or http://remax.com/. The ML# is S260830. Dorwin is located between Valley Drive and South Salina Street, at the very southern edge of the city. Green Hills (the grocery store) is only a couple blocks away.
If that doesn't entice you - I'll also have refreshments tomorrow!
Subscribe to:
Posts (Atom)