Today, the Bureau of Economic Analysis (BEA) released their second "estimate" of the Q4 2011 GDP report showing that the economy continued to expand at a faster pace than originally estimated with real GDP increasing at an annualized rate of 3.0% from Q3 2011.
On a year-over-year basis real GDP increased 1.62% while the quarter-to-quarter non-annualized percent change was 0.74%.
The latest quarterly results indicate that the most notable source of weakness in the economy came from government defense spending which declined at a rate of 12.1% from Q3 while change in private nonfarm inventories made notable contributions accounting for 1.87% of the percent change of final real GDP while providing the majority of the 20.6% quarter-to-quarter rate of change for the entire Gross Private Domestic Investment category.
That very same category also saw fixed residential investment expand at a rate of 11.5% while fixed non-residential structures declined at a rate of 2.6% over the same period.
Keep in mind that these results are likely very poorly estimated and are sure to be revised notably in following quarters and even years to come.
Wednesday, February 29, 2012
Reading Rates: MBA Application Survey – February 29 2012
The Mortgage Bankers Association (MBA) publishes the results of a weekly applications survey that covers roughly 50 percent of all residential mortgage originations and tracks the average interest rate for 30 year and 15 year fixed rate mortgages as well as the volume of both purchase and refinance applications.
The purchase application index has been highlighted as a particularly important data series as it very broadly captures the demand side of residential real estate for both new and existing home purchases.
The latest data is showing that the average rate for a 30 year fixed rate mortgage (from FHA and conforming GSE data) declined 2 basis points to 3.965% since last week while the purchase application volume increased 0.9% and the refinance application declined 2.2% over the same period.
With rates trending ever lower, the economy weak and the FOMC members remaining dovish, it will be interesting to see how far rates on the long end can decline. All things being equal, falling home prices, declining purchase applications and record low long lending rates all appear to indicate a deflationary for the macro-economy.
The following chart shows the average interest rate for 30 year and 15 year fixed rate mortgages since 2006 as well as the purchase, refinance and composite loan volumes (click for larger dynamic full-screen version).
Tuesday, February 28, 2012
S&P/Case-Shiller: December 2011
Note... be sure to bookmark the overall S&P/Case-Shiller Dashboard or the Scary Housing Dashboard of the weakest markets for a real-time view of all the markets tracked by S&P.
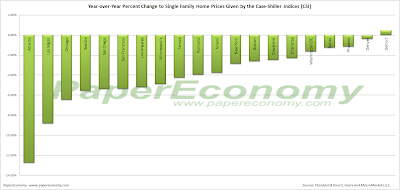
The latest release of the S&P/Case-Shiller (CSI) home price indices for December reported that the non-seasonally adjusted Composite-10 price index declined 1.08% since November while the Composite-20 index declined 1.11% over the same period resulting in the lowest level seen to on the Composite-10 since June 2003 and the largest peak decline seen since the nearly six year old housing bust began in 2006.
The latest CSI data clearly indicates that the price trends are experiencing a declining trend into the typically less active summer and fall season and as I recently pointed out, the more timely and less distorted Radar Logic RPX data is continuing to capture notable falling prices driven primarily by seasonality.
The 10-city composite index declined 3.94% as compared to December 2010 while the 20-city composite declined 3.99% over the same period.
Topping the list of regional peak decliners was Las Vegas at -61.36%, Phoenix at -55.19%, Miami at -50.97%, Tampa at -47.47% and Detroit at -46.17%.
Additionally, both of the broad composite indices show significant peak declines slumping -33.76% for the 10-city national index and -33.80% for the 20-city national index on a peak comparison basis.
To better visualize today’s results use Blytic.com to view the full release.
Monday, February 27, 2012
Pending Home Sales: January 2012
Today, the National Association of Realtors (NAR) released their Pending Home Sales Report for January showing that pending home sales improved with the seasonally adjusted national index climbing 2% since December while increasing 8% above the level seen in January 2011.
Meanwhile, the NARs chief economist Lawrence Yun suggests that today's results indicates "stabilization" for prices and increased activity for the year.
“Given more favorable housing market conditions, the trend in contract activity implies we are on track for a more meaningful sales gain this year. With a sustained downtrend in unsold inventory, this would bring about a broad price stabilization or even modest national price growth, of course with local variations.”
The following chart shows the seasonally adjusted national pending home sales index along with the percent change on a year-over-year basis as well as the percent change from the peak set in 2005 (click for larger version).
Saturday, February 25, 2012
Catching Up Part 2: Papaw & My New Obsessions
Well this past weekend we took a little surprise road trip... :) It was so fun to just get away and relax and visit with our family down in Virginia and Tennessee.
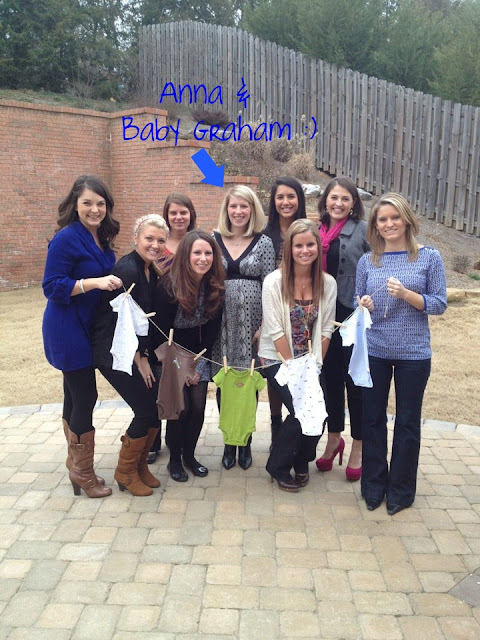
We planned to go down so that I could attend my cousin, Anna's, baby shower in Knoxville!
I wouldn't have missed it for the world... she is the sweetest, kindest, most caring person and through the years we have stayed close even though never really living in the same state I don't think ha ... but I was so thrilled for her and her husband when they found out they were pregnant and I was set on making sure I could attend her shower! I'm doing a separate post on this later to show her cute shower!
Before we went to Knoxville, we actually went to see my Papaw and stayed with him for two nights...I also got to see my Aunt Cathy and celebrate a super late Christmas!
My papaw is seriously one of the funniest people you would ever meet... and he doesn't even try to be.
Before we went to Knoxville, we actually went to see my Papaw and stayed with him for two nights...I also got to see my Aunt Cathy and celebrate a super late Christmas!
My papaw is seriously one of the funniest people you would ever meet... and he doesn't even try to be.
This was him at my brother's 21st birthday party haha just being funny.. don't think he's ever had a drink of alcohol in his life which makes this even more funny.
Some of his classic one liners while we were visiting included:
(Preface.. my brother has a cute little dog named Whiskey that my Papaw met last time we were there)
Papaw: "How's that dog of yours? Does he pass out a lot?
My Brother: "He's good... and no, why would he pass out?
Papaw: "With a name like that I figured he'd be passed out all the time"
You just have to know him, he doesn't even laugh when he says this stuff... which makes it even more funny! hahaha
My Brother: " Papaw, is Cracker Barrel ok with you for breakfast tomorrow?
Papaw: "Why I guess that would be fine, but I gotta eat more than crackers"
Another good one...
Me: On my phone, looking at Facebook
Papaw: "What are ya doin? Tweetering?"
Me:"No hahahaha I'm looking on Facebook Papaw, and it's Twitter or tweeting...not tweetering!
Papaw: "Well whatever it's called... don't matter much to me... these computers are the mark of the beast! They won't be around much longer...
HAHAHAHA ... mark of the beast?? LOL that's classic
and my personal favorite was ...
Me: "What is that building going to be that's going up down the street?"
Papaw: 'Oh they said it's going to be another place to eat ... somethin called the Olive Garden... I suppose that's where they grow olives... in their garden..."
Pretty clever he is... prettttty clever ha.
Even more funny hearing him say these things... you honestly can't help but crack up! He is too much.
We took him to White Top Mountain in VA ... it was pretty cool I must admit.. I am not the "mountain" type and felt like I was going to vomit the entire ride up there on the curvy roads while my ears were popping nonstop ha. But once we got up there it was awesome... it was beautiful that day .. sunny and 55 degrees... but the elevation is so high up that it was freezing up on top and ice all over the trees! Crazy!!
How pretty is that? Look at those mountains!
Me and Papaw :) Can you tell I was freeeeezing up there? ha
Chris and I :)
My brother, Chris.
It was a good time for sure! Beautiful place!
We had a great time, can't wait to see him again for Keeneland when he is coming up to stay with us for a weekend!
Now, because I have been a blogging slacker lately... I wanted to share with you some of my favorite things right now... just for fun :)
I FINALLY jumped on the band wagon and got one of these...
Clarisonic Mia
She is my new BFF.
I don't know why I have waited this entire time to get one... PinkLouLou and ShastaAnne raved about them probably a year ago and I don't know why I didn't listen then?! It is amazing. Period. Love it.
Now I will say, it is making my face break out for a minute, just to totally keep it real for ya ha. But I am fighting thru the break out because I know it is just doing it's job and bringing out the dirt. I have faith it will go away in a day or so. My face has never felt softer and it looks more glowing kind of?
How cute is that bracelet? We all know my obsession with bracelets... cheap and/or expensive.. I love them all, especially if they have glitter ha. This one above I just got today... from Crewcuts... the kid's part of JCrew... for $10.50 :)
Love it! They have different colors too. But I like the gold the best!
My next obsession...
These smoothie Yoplait mixes!
They are delicious!
You just add milk and the mix (and a little peanut butter which is my fave!) then Voila! Amazingness!
My favorite flavor is ...
Triple Berry! So good and actually keeps me full for half the day pretty much!
Lastly...
I am obsessed with side pony braids.... so quick and easy and cute... love them!
Do you love them?
I think they will be fun for the Summer too!
Well that's all I've got for today..
OH wait ... HAPPY BIRTHDAY to my Mom!! Today is her actual birthday but we are celebrating tomorrow night for dinner :) Love ya Mom! XO
Friday, February 24, 2012
New Home Sales: January 2012
Today, the U.S. Census Department released its monthly New Residential Home Sales Report for January showing a monthly decline with sales dropping 0.97% since December but rising 3.55% above the level seen in January 2011 and remaining at an historically low level of 321K SAAR units.
It's important to recognize that the inventory of new homes has now fallen to a new series low at 151K units, lowest level seen in in at least 47 years while the median number of months for sale increased to 7.1.
The monthly supply declined to 5.6 months while the median selling price declined 9.57% and the average selling price declined 5.11% from the year ago level.
The following chart show the extent of sales decline to date (click for full-larger version).
Labels:
economy,
housing,
new home sales
Thursday, February 23, 2012
Skaneateles Real Estate - The Weekly Update
So there I was, all poised to write this blog last night. Research done, thoughts composed, SU game still in the future....but I couldn't get in to blogger! Best laid plans and all that.
Currently there are 84 - ONLY! - active listings in the Skaneateles area of the multiple listing service. Of these, 24 are in the Village and 20 are waterfront. One new one came on this past week in the mid-$200,000 range.
There are 6 homes marked contingent, 7 in the "under contract" category, and 5 pending. None of these are new.
However - continuing on with our good fortune or pent-up needs, there is another closed sale! This brings our year-to-date number to 10. The one that closed was under $200,000 and in the town.
I told someone that we had a dozen homes listed under $200,000 - just off the top of my head. So I checked, and there are actually 15. The largest number come between $200,000 and $400,000 - 30 homes. Between $400,000 and $800,000 there are 25, and that leaves an amazing 15 listed for over $800,000. (And adding it up I see that somewhere a house appears in two categories - which is why people try for the even numbers so they won't be excluded on the internet. For example, if I were to list a home at $499,900....it would be missed by people starting at 500K. Unbelievable, but true!)
So come to my open house this Sunday from 1:00 until 3:00 at one of the "under $200,000" homes. This is 1650 Coon Hill Road, literally just minutes from the village down East Lake Road. Hopefully the weather will allow you to soak up the sun in the three-season room (see below) and walk out into the huge back yard over to the stream. It's really a lovely home - very, very comfortable. When you come, tell me you read about it on my blog.
FHFA Monthly Home Prices: December 2011
Today, the Federal Housing Finance Agency (FHFA) released the latest results of their monthly house price index (HPI) showing that, nationally, home prices increased 0.71% since November and declined 1.32% below the level seen in December 2010.
The FHFA monthly HPI are formulated from home purchase information collected from mortgages that have been sold to or guaranteed by Fannie Mae and Freddie Mac.
Labels:
economy,
FHFA,
home prices,
housing
Extended Unemployment: Initial, Continued and Extended Unemployment Claims February 23 2012
Today’s jobless claims report showed that initial unemployment claims went flat while continued unemployment claims declined as seasonally adjusted initial claims continued to trend well below the closely watched 400K level.
Seasonally adjusted “initial” went unchanged at 351,000 claims from last week’s revised 351,000 claims while seasonally adjusted “continued” claims declined by 52,000 resulting in an “insured” unemployment rate of 2.7%.
Since the middle of 2008 though, two federal government sponsored “extended” unemployment benefit programs (the “extended benefits” and “EUC 2008” from recent legislation) have been picking up claimants that have fallen off of the traditional unemployment benefits rolls.
Currently there are some 3.40 million people receiving federal “extended” unemployment benefits.
Taken together with the latest 3.98 million people that are currently counted as receiving traditional continued unemployment benefits, there are 7.39 million people on state and federal unemployment rolls.
Wednesday, February 22, 2012
Existing Home Sales Report: January 2012
Today, the National Association of Realtors (NAR) released their Existing Home Sales Report for January showing an increase in sales with total home sales climbing 5.0% since November and 3.6% above the level seen in December 2010.
Single family home sales increased 3.8% from December and rose 2.3% above the level seen in January 2011 while the median selling price declined 2.6% below the level seen in January 2011.
Inventory of single family homes increased 1.5% from December dropping 18.9% below the level seen in January 2011 which resulted in a monthly supply of 6.1 months.
The following charts (click for full-screen dynamic version) shows national existing single family home sales, median home prices, inventory and months of supply since 2005.
Single family home sales increased 3.8% from December and rose 2.3% above the level seen in January 2011 while the median selling price declined 2.6% below the level seen in January 2011.
Inventory of single family homes increased 1.5% from December dropping 18.9% below the level seen in January 2011 which resulted in a monthly supply of 6.1 months.
The following charts (click for full-screen dynamic version) shows national existing single family home sales, median home prices, inventory and months of supply since 2005.
Labels:
economy,
existing home sales,
housing
Reading Rates: MBA Application Survey – February 22 2012
The Mortgage Bankers Association (MBA) publishes the results of a weekly applications survey that covers roughly 50 percent of all residential mortgage originations and tracks the average interest rate for 30 year and 15 year fixed rate mortgages as well as the volume of both purchase and refinance applications.
The purchase application index has been highlighted as a particularly important data series as it very broadly captures the demand side of residential real estate for both new and existing home purchases.
The latest data is showing that the average rate for a 30 year fixed rate mortgage (from FHA and conforming GSE data) went unchanged at 3.98% since last week while the purchase application volume declined 2.9% and the refinance application declined 4.8% over the same period.
With rates trending ever lower, the economy seemingly near recession and the FOMC members becoming more dovish by the day, it will be interesting to see how far rates on the long end can decline. All things being equal, falling home prices, declining purchase applications and record low long lending rates all appear to indicate a deflationary for the macro-economy.
The following chart shows the average interest rate for 30 year and 15 year fixed rate mortgages since 2006 as well as the purchase, refinance and composite loan volumes (click for larger dynamic full-screen version).
Tuesday, February 21, 2012
Catching Up Part 1: V-Day!
Hiiiiiya!
I'll tell you what, people who say blogging is addicting sure know what they are talking about! It has officially been 10 days since I have blogged, and I feel empty haha.
I have not slacked on purpose, so don't judge, but I have seriously been super busy selling some houses (yay!)... then sick :( ... then out of town for a mini vaca (post to come!)... and then super busy again! I feel like I have so much to share... but I think I'm going to break them down into a couple different posts this week as to not totally picture overload yall!
Since I missed Valentine's Day :( I thought it would be fun to share a little bit of my day ...
the day before we did some fun little presents with the kids...
They had fun, we got them little surprises and some candy... we got the girls each a Moon & Lola monogrammed necklace and they loved them! (Need to post pic, forgot to take one!)
The next morning Jake was over so I fixed him a Valentine's Day breakfast :)
(Sorry the pic is sideways)
Heart Shaped Waffles (his fave) with red sprinkles!
That day I had a special shirt I had been hiding in my closet for weeks to wear for Chris hehe
However, I was apparently on something that day and took a pic myself so it is backwards lol and the only picture I got all day of it! :( It was so cute, a baseball type tee that said I Heart My Boyfriend! Got it at Target, Chris thought it was so cute :) I wore it all day and even to dinner, instead of the pink silk shirt I had planned on wearing lol
He surprised me (ok not really, I knew he would get them, they are my favorite!) with chocolate covered strawberries!!
Yummmm!!!
He brought me TWO things of flowers... some beautiful mixed ones and then also a new orchid that is so pretty... he gave me one two years ago and I kept it alive all this time until recently when it kicked the bucket, so now I have a new one :)
And then this lovely pressent, which was SO unexpected...
I opened this and was so excited!!
The Hugs & Kisses Package from The Massage Center
what might this include you ask?
LOTS of goodies... :)
60 minute Relaxation Massage
15 minute Salt Glow - feet & legs
15 minute Facelift Massage
How sweet was that?
I am so looking forward to spending some time relaxing and enjoying this present from my sweet honey! Thank you babe! Loved it! XO
We ended the day by going to dinner and me eating way more than I should have! Ha! But it sure was yummy!
Hope all your Valentine's Days were just as sweet and fun!
Oh, in unrelated news... have you seen these in your Kroger????
These little handy dandy touch screen thingys are awesome.. you scroll through different recipes and then once you find the one you like, you print it out and it gives you the ingredients and recipe right there while you're at the grocery! Genius! Why didn't I think of this?? Great idea! :)
And in case anyone was wondering... Frankie got all spiffed up and got a cute new haircut for Valentine's Day...
He was waiting on Miss Daisy May to give him a ring, but that unfortunately didn't happen and we have since then talked and realized that he is the man, he should have made the first move... epic fail... :( LOL
I have loads more to share.. will be back tomorrow talking about the mini vaca we took this past weekend :)
XO,
Subscribe to:
Posts (Atom)